I suppose when you’re getting an answer from a computer, the definition of ‘approximate’ is going to be different from a human … like 7 digits of precision!
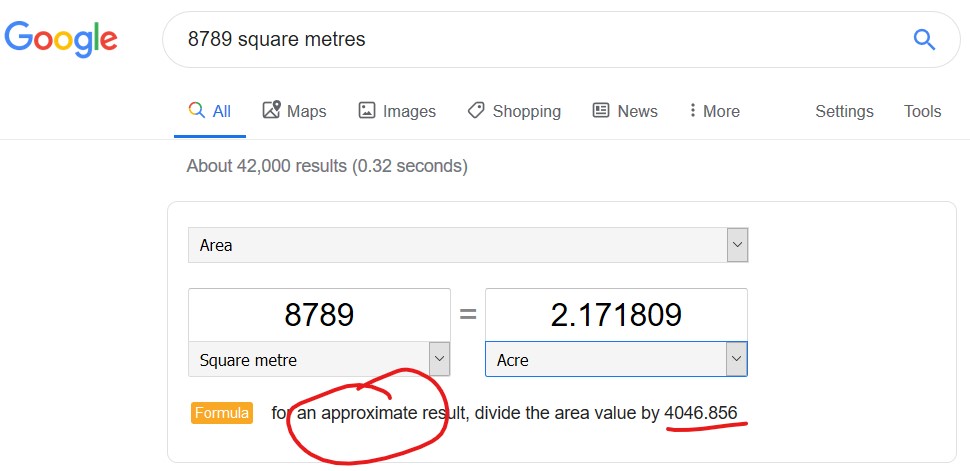

I suppose when you’re getting an answer from a computer, the definition of ‘approximate’ is going to be different from a human … like 7 digits of precision!
Newcastle Council is currently constructing a new section of cycleway on Jackson St Hamilton North, which is on my regular route of cycling to work. I’m feeling pretty ambivalent about it. On the one hand I’m pleased to see any money spent on cycleway infrastructure. But on the other hand this project continues a tradition of building cycleways where they are least needed, and by implication not building them where they are needed.

Jackson St, Hamilton North.
Jackson St in Hamilton North is effectively a hybrid one-way street/cul-de-sac, as you can’t turn into it from Griffiths Rd. Apart from school start/end times it is a very quiet street with virtually no traffic, and therefore little added benefit in having a cycleway separate to the road. (If you click on the photo and zoom in, you can actually see a person standing in the middle of the street, with absolutely no danger of being hit by a car!)
Its a similar scenario on Griffiths Road alongside Richardson Park, where last year the council constructed a cycleway along a section of road that already had a wide and rarely occupied verge/cycle lane.
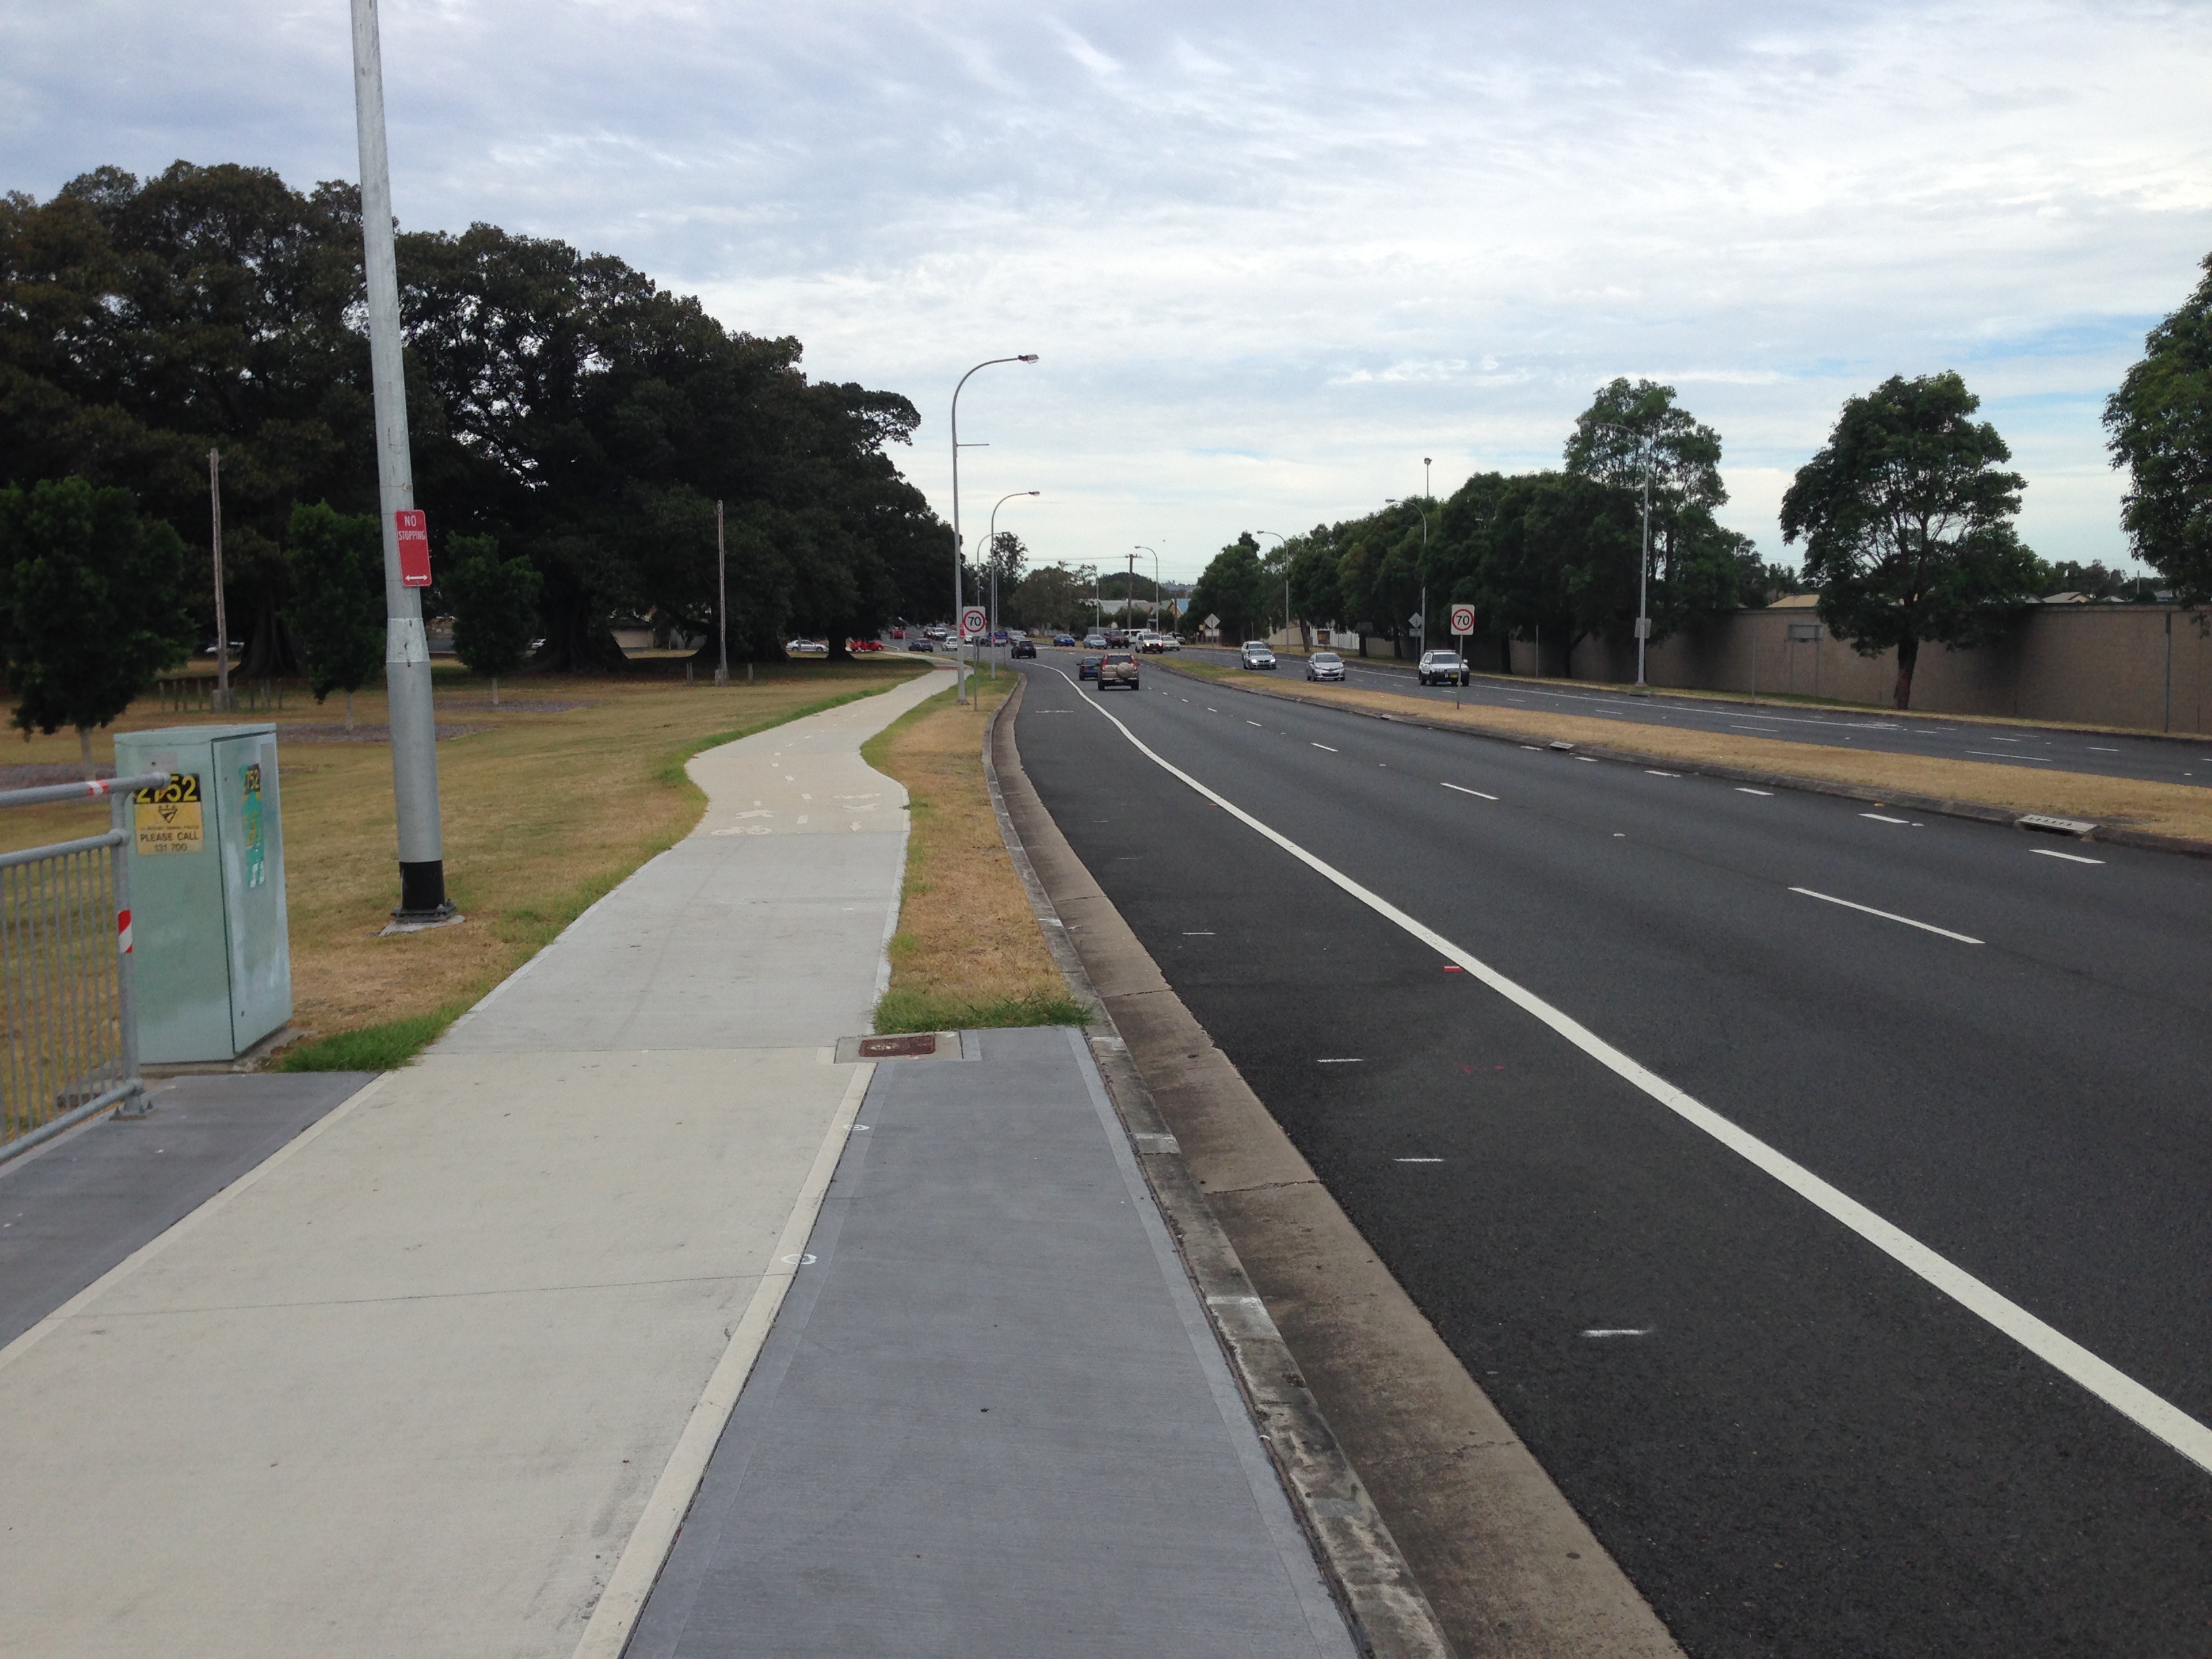
Griffiths Rd, Hamilton North.
And the same scenario on Hobart Rd New Lambton, a year or two ago when a new cycle path was constructed along a section of road with a rarely occupied parking/cycle lane.
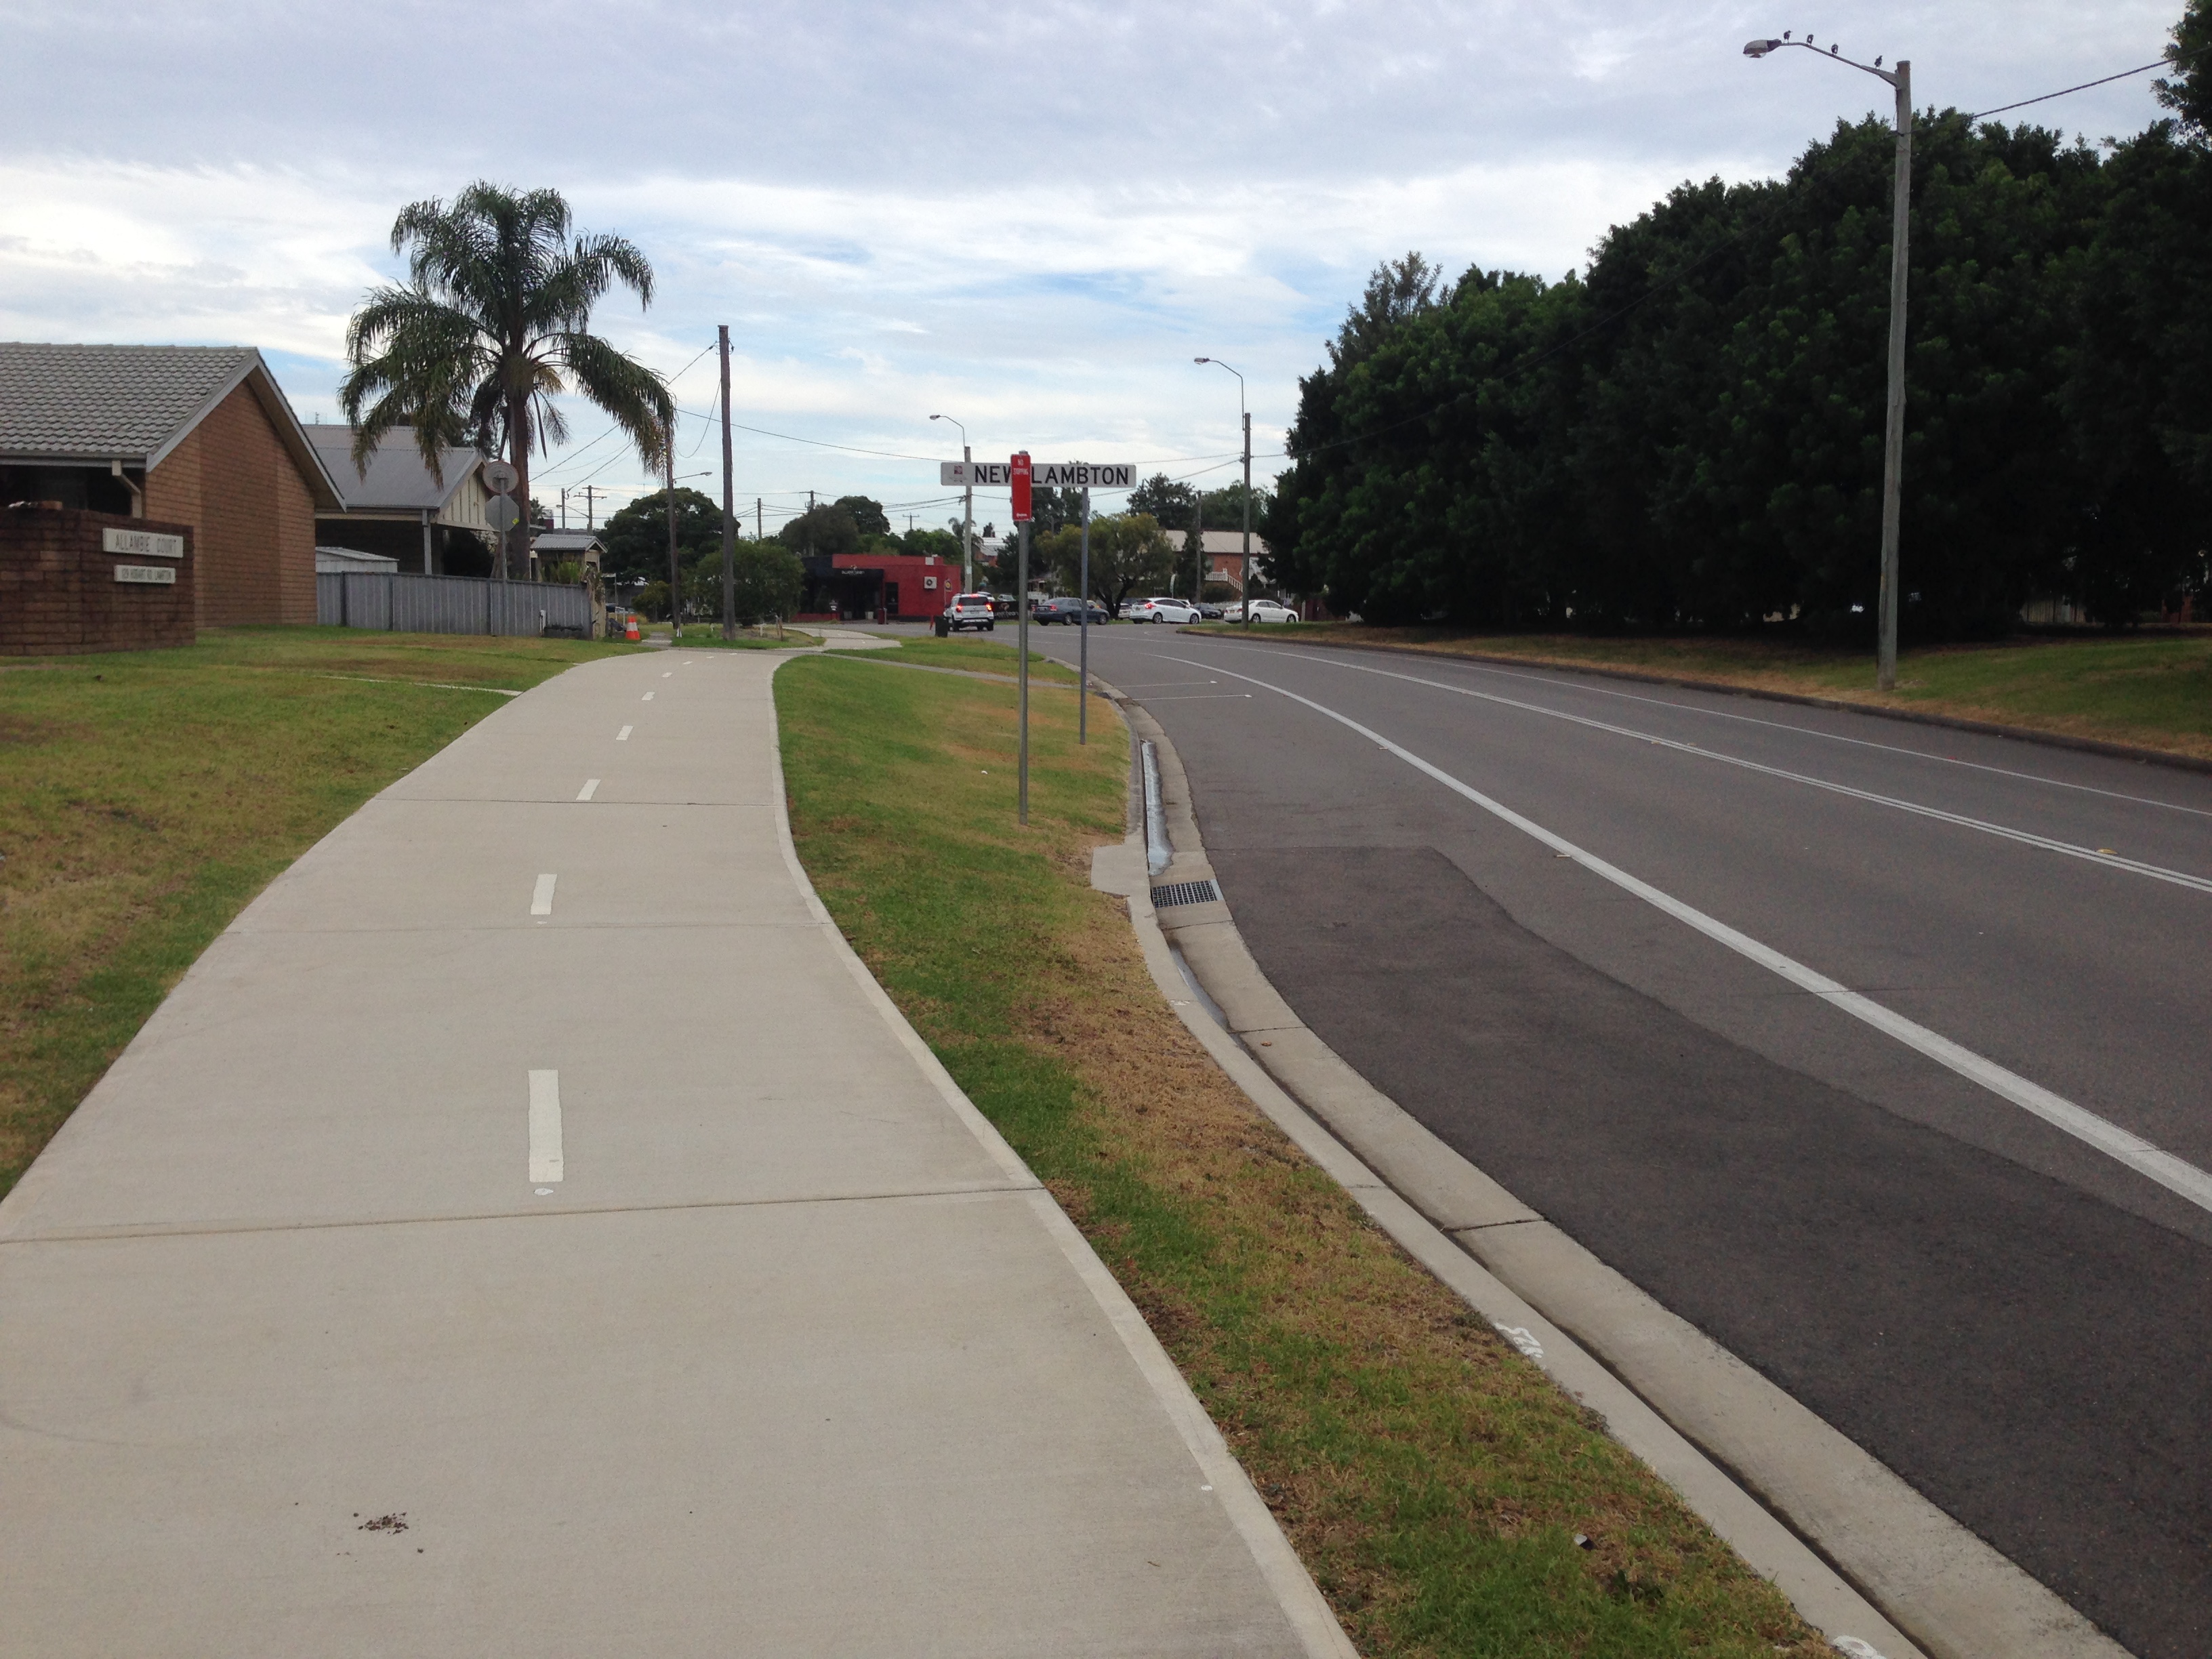
Hobart Rd, New Lambton.
I’m guessing that the reason why the cycle paths are being built where they’re not really needed is that council has only a limited budget for cycling infrastructure – the places where cycleways are needed are in congested areas, where construction would be difficult and expensive, and the budget isn’t big enough. So instead the only option is to spend the money on smaller, easier projects, which will tend to be in locations where a separate cycle path isn’t really needed.
So where is it needed? My regular cycling route from Lambton to Wickham is fairly cycle friendly, so I don’t have much to complain of. The most obvious spot for improvement is Chatham Rd, Clyde St, and the Clyde St railway crossing in Hamilton North. I’d love to see a dedicated cycle path along this stretch.
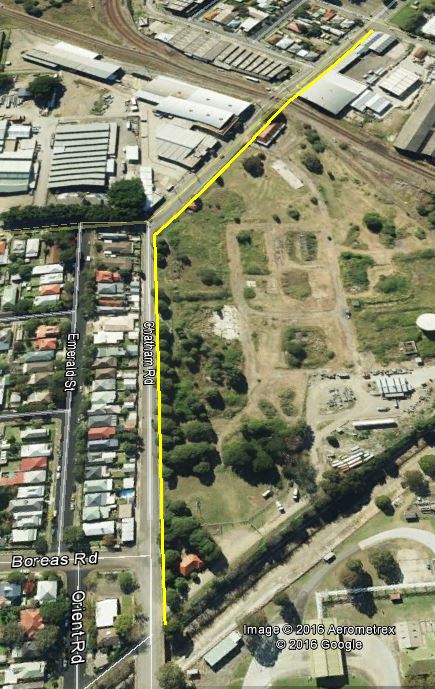
A cycleway here, please.
Actually, if I dream big dreams like Mark MacLean, I’d love to see a cycleway built on the following route, after the former gasworks site is remediated and turned into a nature reserve.
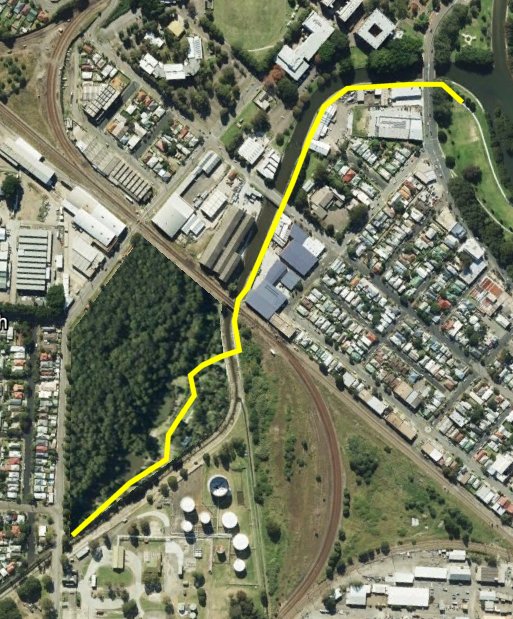
A cycleway here, pretty please?
And finally, there is one other thing that makes me less than excited about the new cycleway in Jackson St – and that’s the pace of construction.

Jackson Street shared pathway construction.
The council’s sign says that constructing 375 metres of cyclist pathway is “expected to take four months”! That works out to an average rate of progress of 3.1 metres per day! That’s a rate that I was going to describe as “glacial”, but when in the interests of scientific accuracy I looked up how fast glaciers can travel, I found that back in 2014 the Jakobshavn Glacier in Greenland made a new world record when its pace was measured at more than 46 metres per day, which is 15 times faster than the Jackson Street cycleway. I am thus forced to invent a new adjective, and describe the pace of construction as “subinfraglacial”.
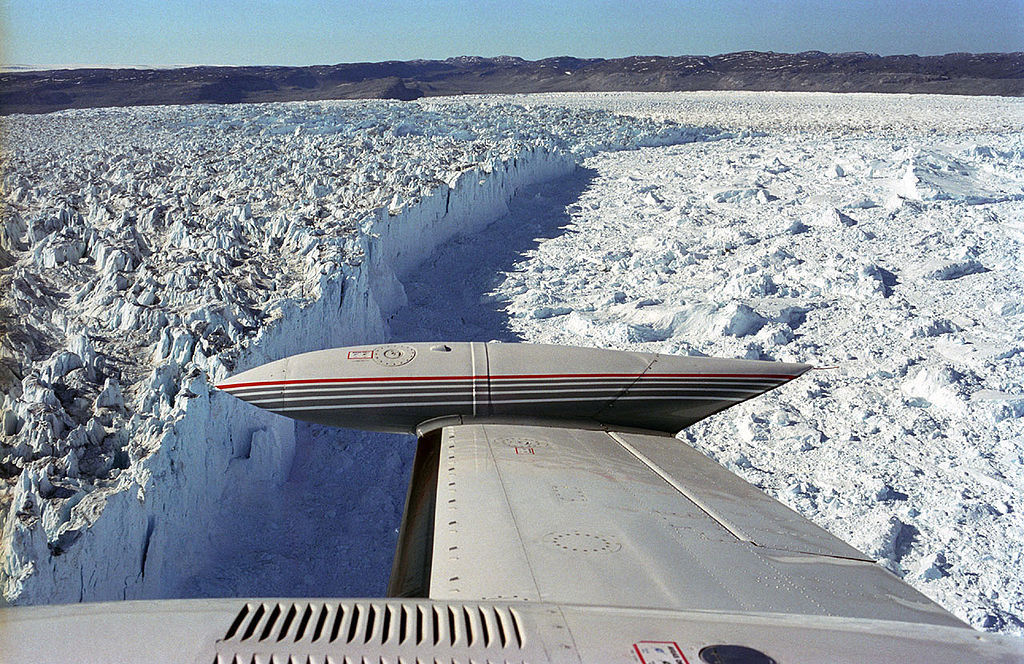
Jakobshavn Glacier. (WikiMedia)
 Back in 2014 a change of residence meant that my bicycle commute to work changed to a route that took me alongside long stretches of the concrete drains that spider across the low lying Newcastle suburbs. For 85% of my commute to work I am within 200 metres of one of the concrete drains, or Throsby Creek.
In a recent conversation with a friend when I mentioned this, they responded with some expression of sympathy and sadness that I had to endure such an ugly travelling companion. As I reflected on this 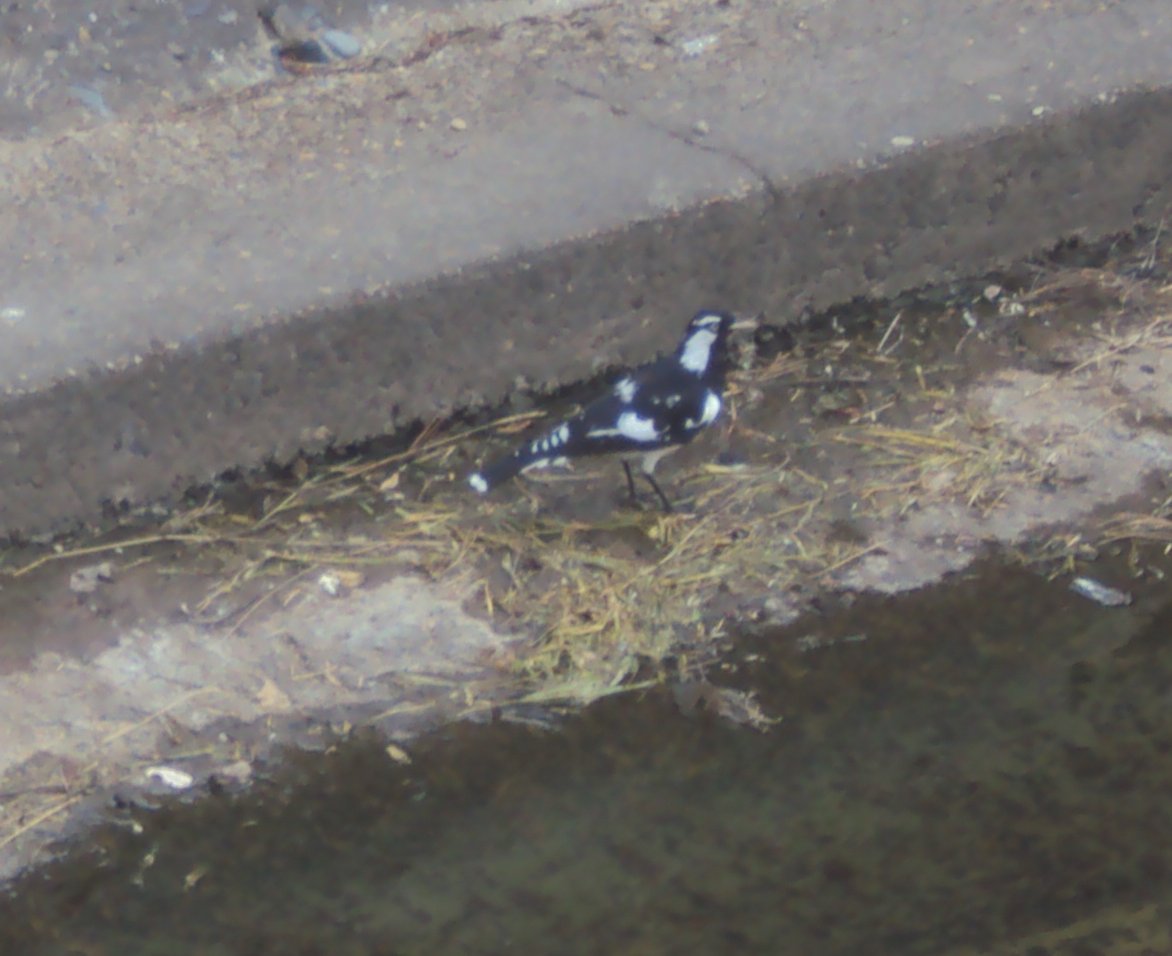 reaction I realised that although the drains are not exactly the most aesthetic feature of our city, there are a number of positives.Firstly, cycling alongside the drains offers relative serenity, in comparison to busy roads. Secondly, the drains often attract a variety of bird life – ducks, ibises, some other kinds of birds, the black and white ones, the fast darting ones, as well as those little fluttery ones. (As much as I like birds, you might correctly guess I’m no ornithologist!)
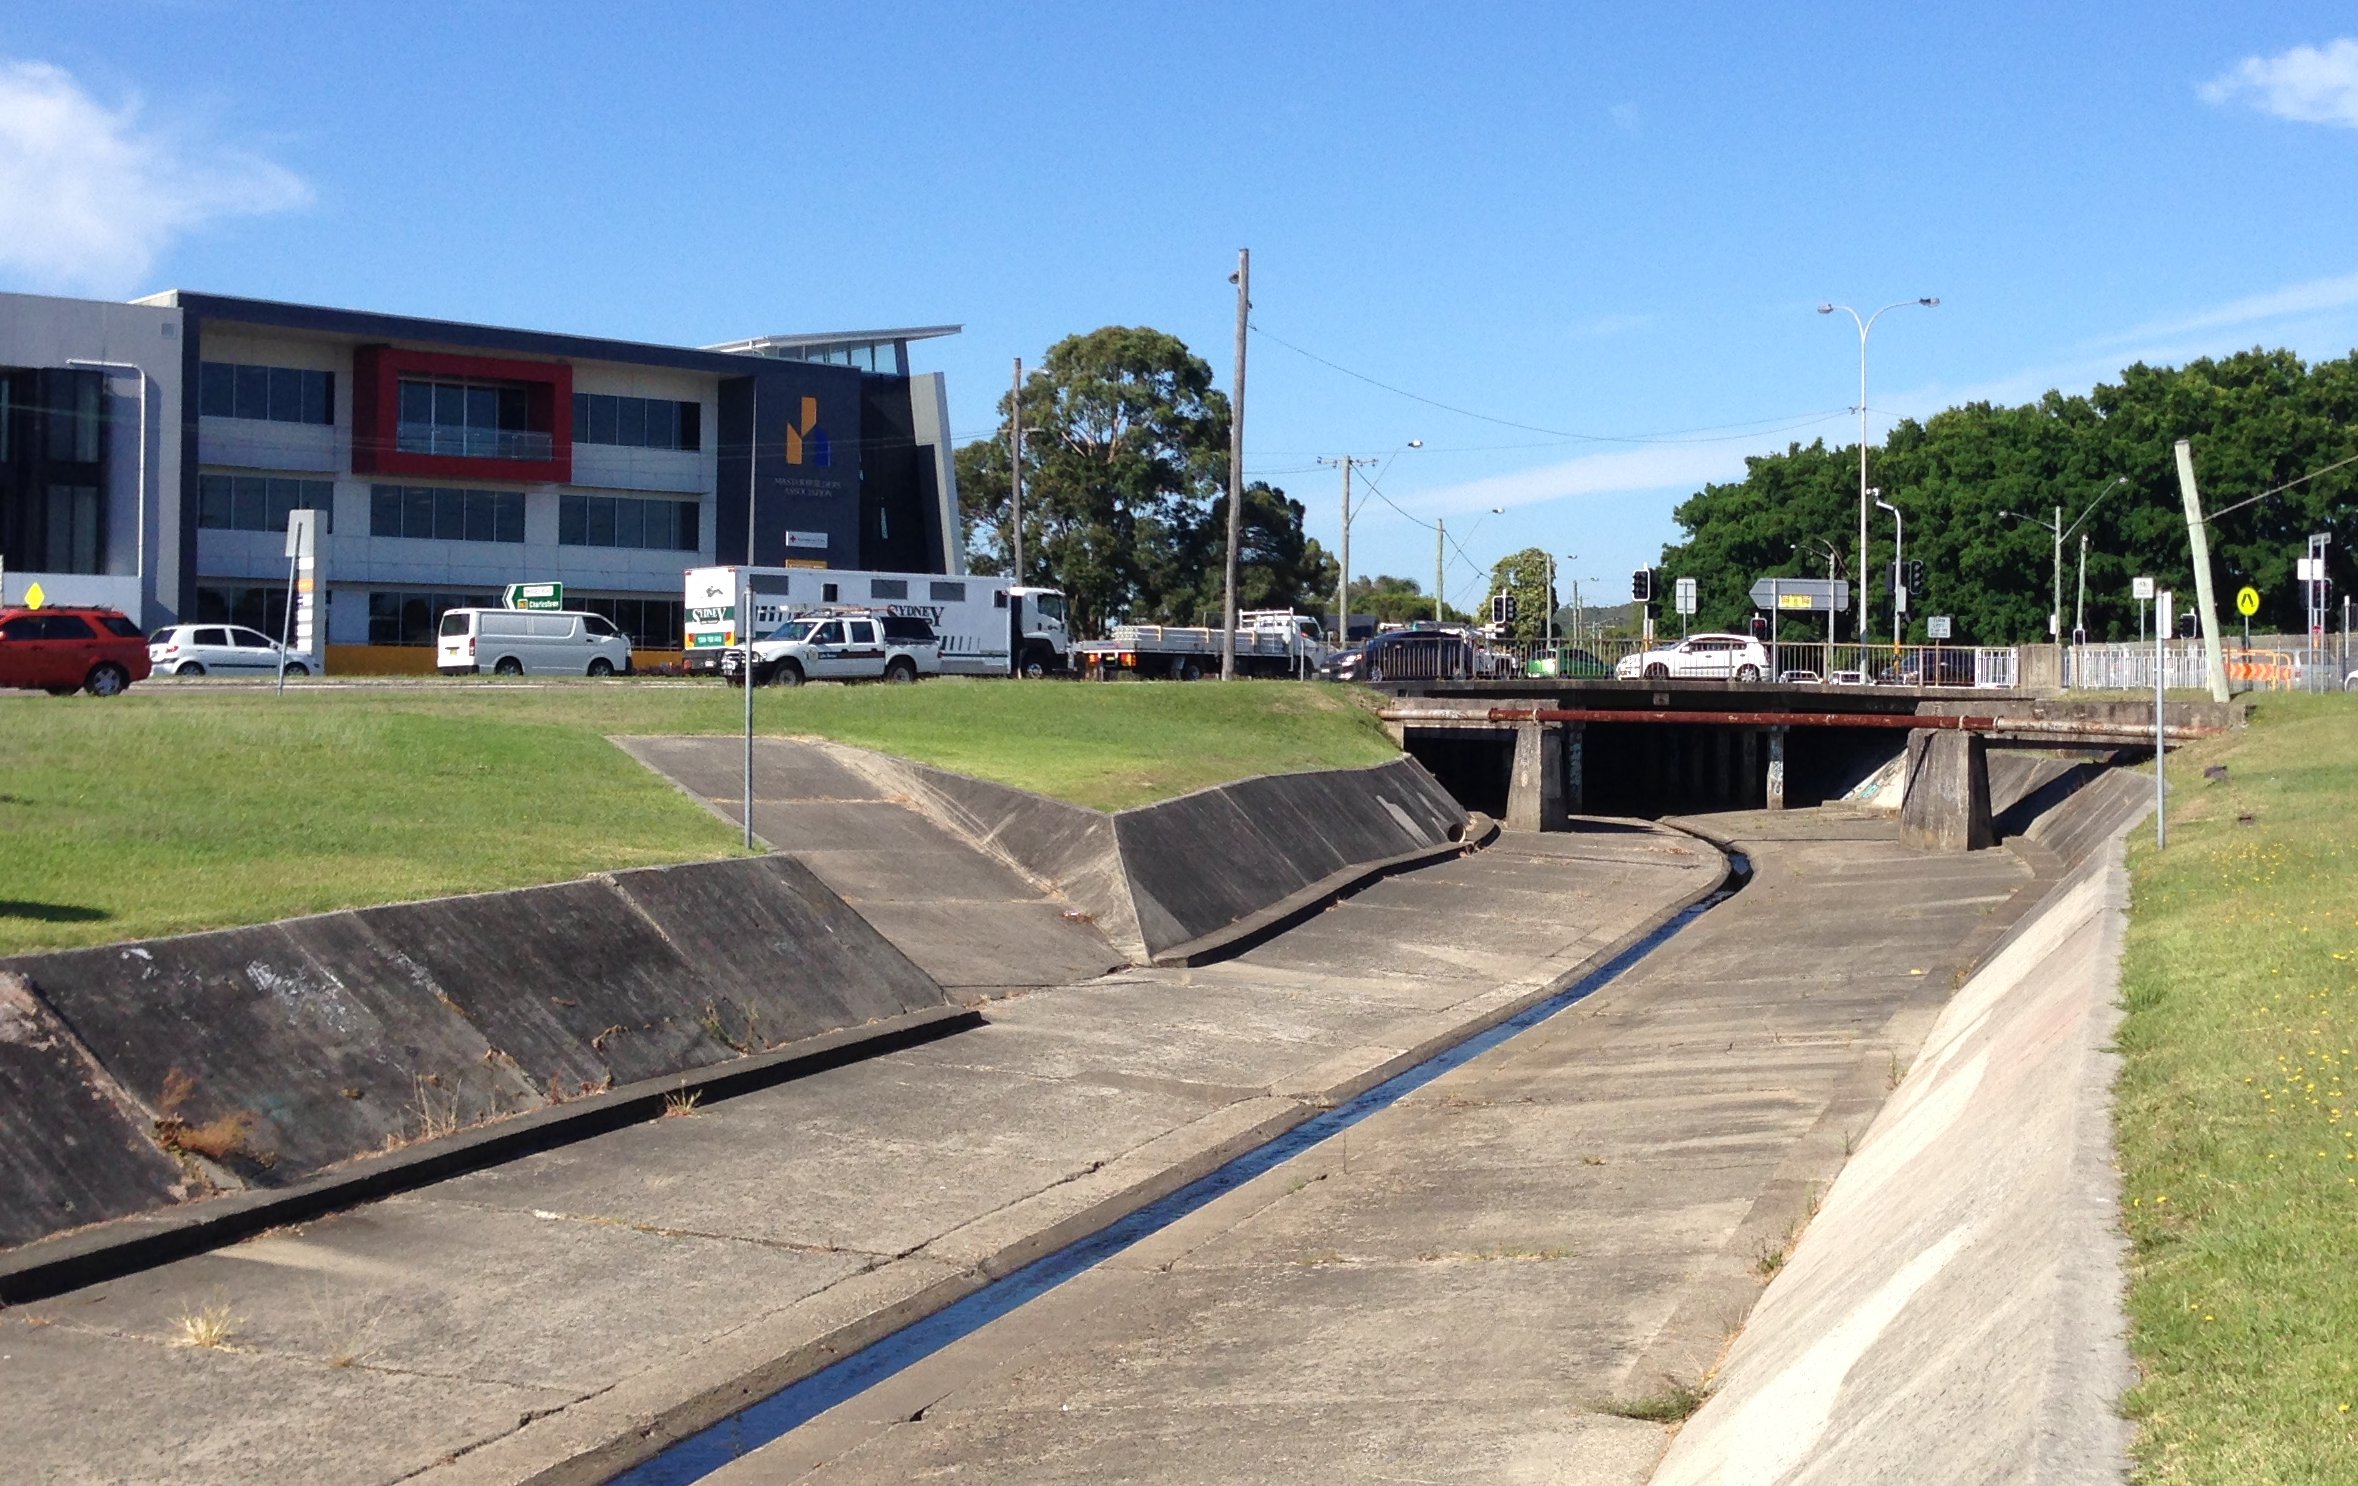
In thinking about the concrete drains I’ve also been pondering their principal purpose – to drain away water. In the downpours of January 2016 I saw this fully in action, and recorded this video of the drain in Broadmeadow near the rescue helicopter base.

It got me thinking. How much water was being carried away each second? Stepping through the frames on the video I was able to see that it took 2.94 seconds for the flow to pass from one concrete seam in the drain to the next. A visit to the drain a few weeks later (when it was dry) to take some measurements revealed the following.
| Distance between cracks: | 9.1m |
| Average width of drain: | 13.4m |
| Average depth of drain: | 1.6m |
| Cross sectional area: | 21.44m2 |
| Water velocity: | 3.1 m/s |
| Flow volume (cubic metres per sec): | 66.4 m3/s |
That’s 66 thousand litres per second. Impressive. Or to put it another way, since a standard size Olympic swimming pool contains 2.5 million litres, the waterway at this point is capable of draining an Olympic sized swimming pool every 38 seconds.
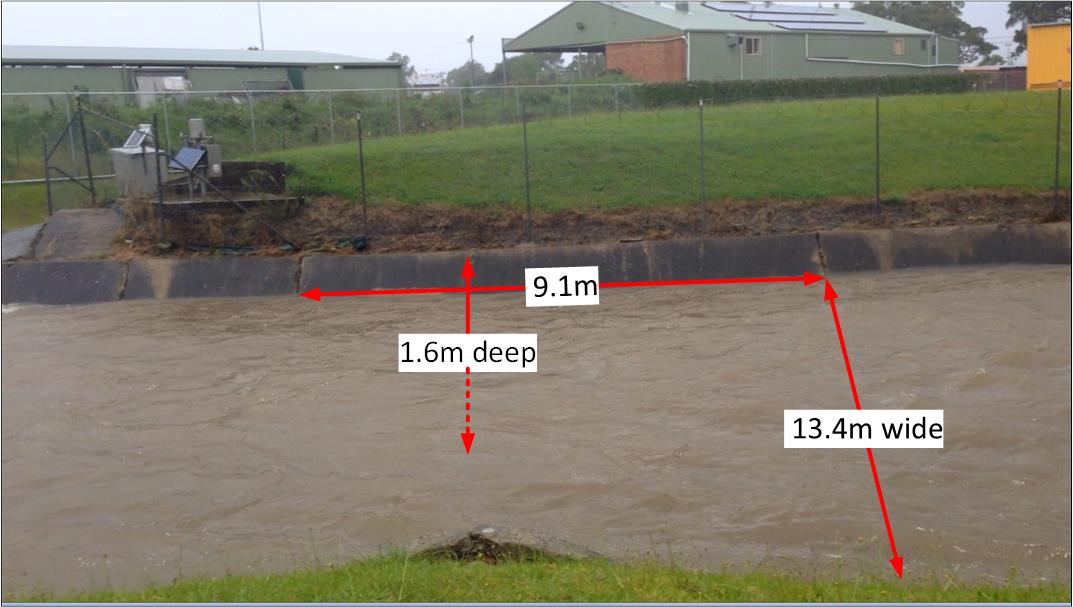
Broadmeadow drain measurements.
[ Note that all these measurements and calculations are ‘back of the envelope’, ‘ballpark figures’ for the purpose of gaining a broad sense of the capabilities of the drain, and not a precise hydrological survey. ]
I’ve also been pondering the economic benefit of these drains. Prior to their construction from 1895 onwards, the lowlands of Newcastle were regularly turned into a useless boggy swampland. A 1892 description of Broadmeadow states that:
“When there are heavy rains the water comes down in such a way as to flood the streets and property, the water being sometimes 12 and 18 inches deep on the streets.”
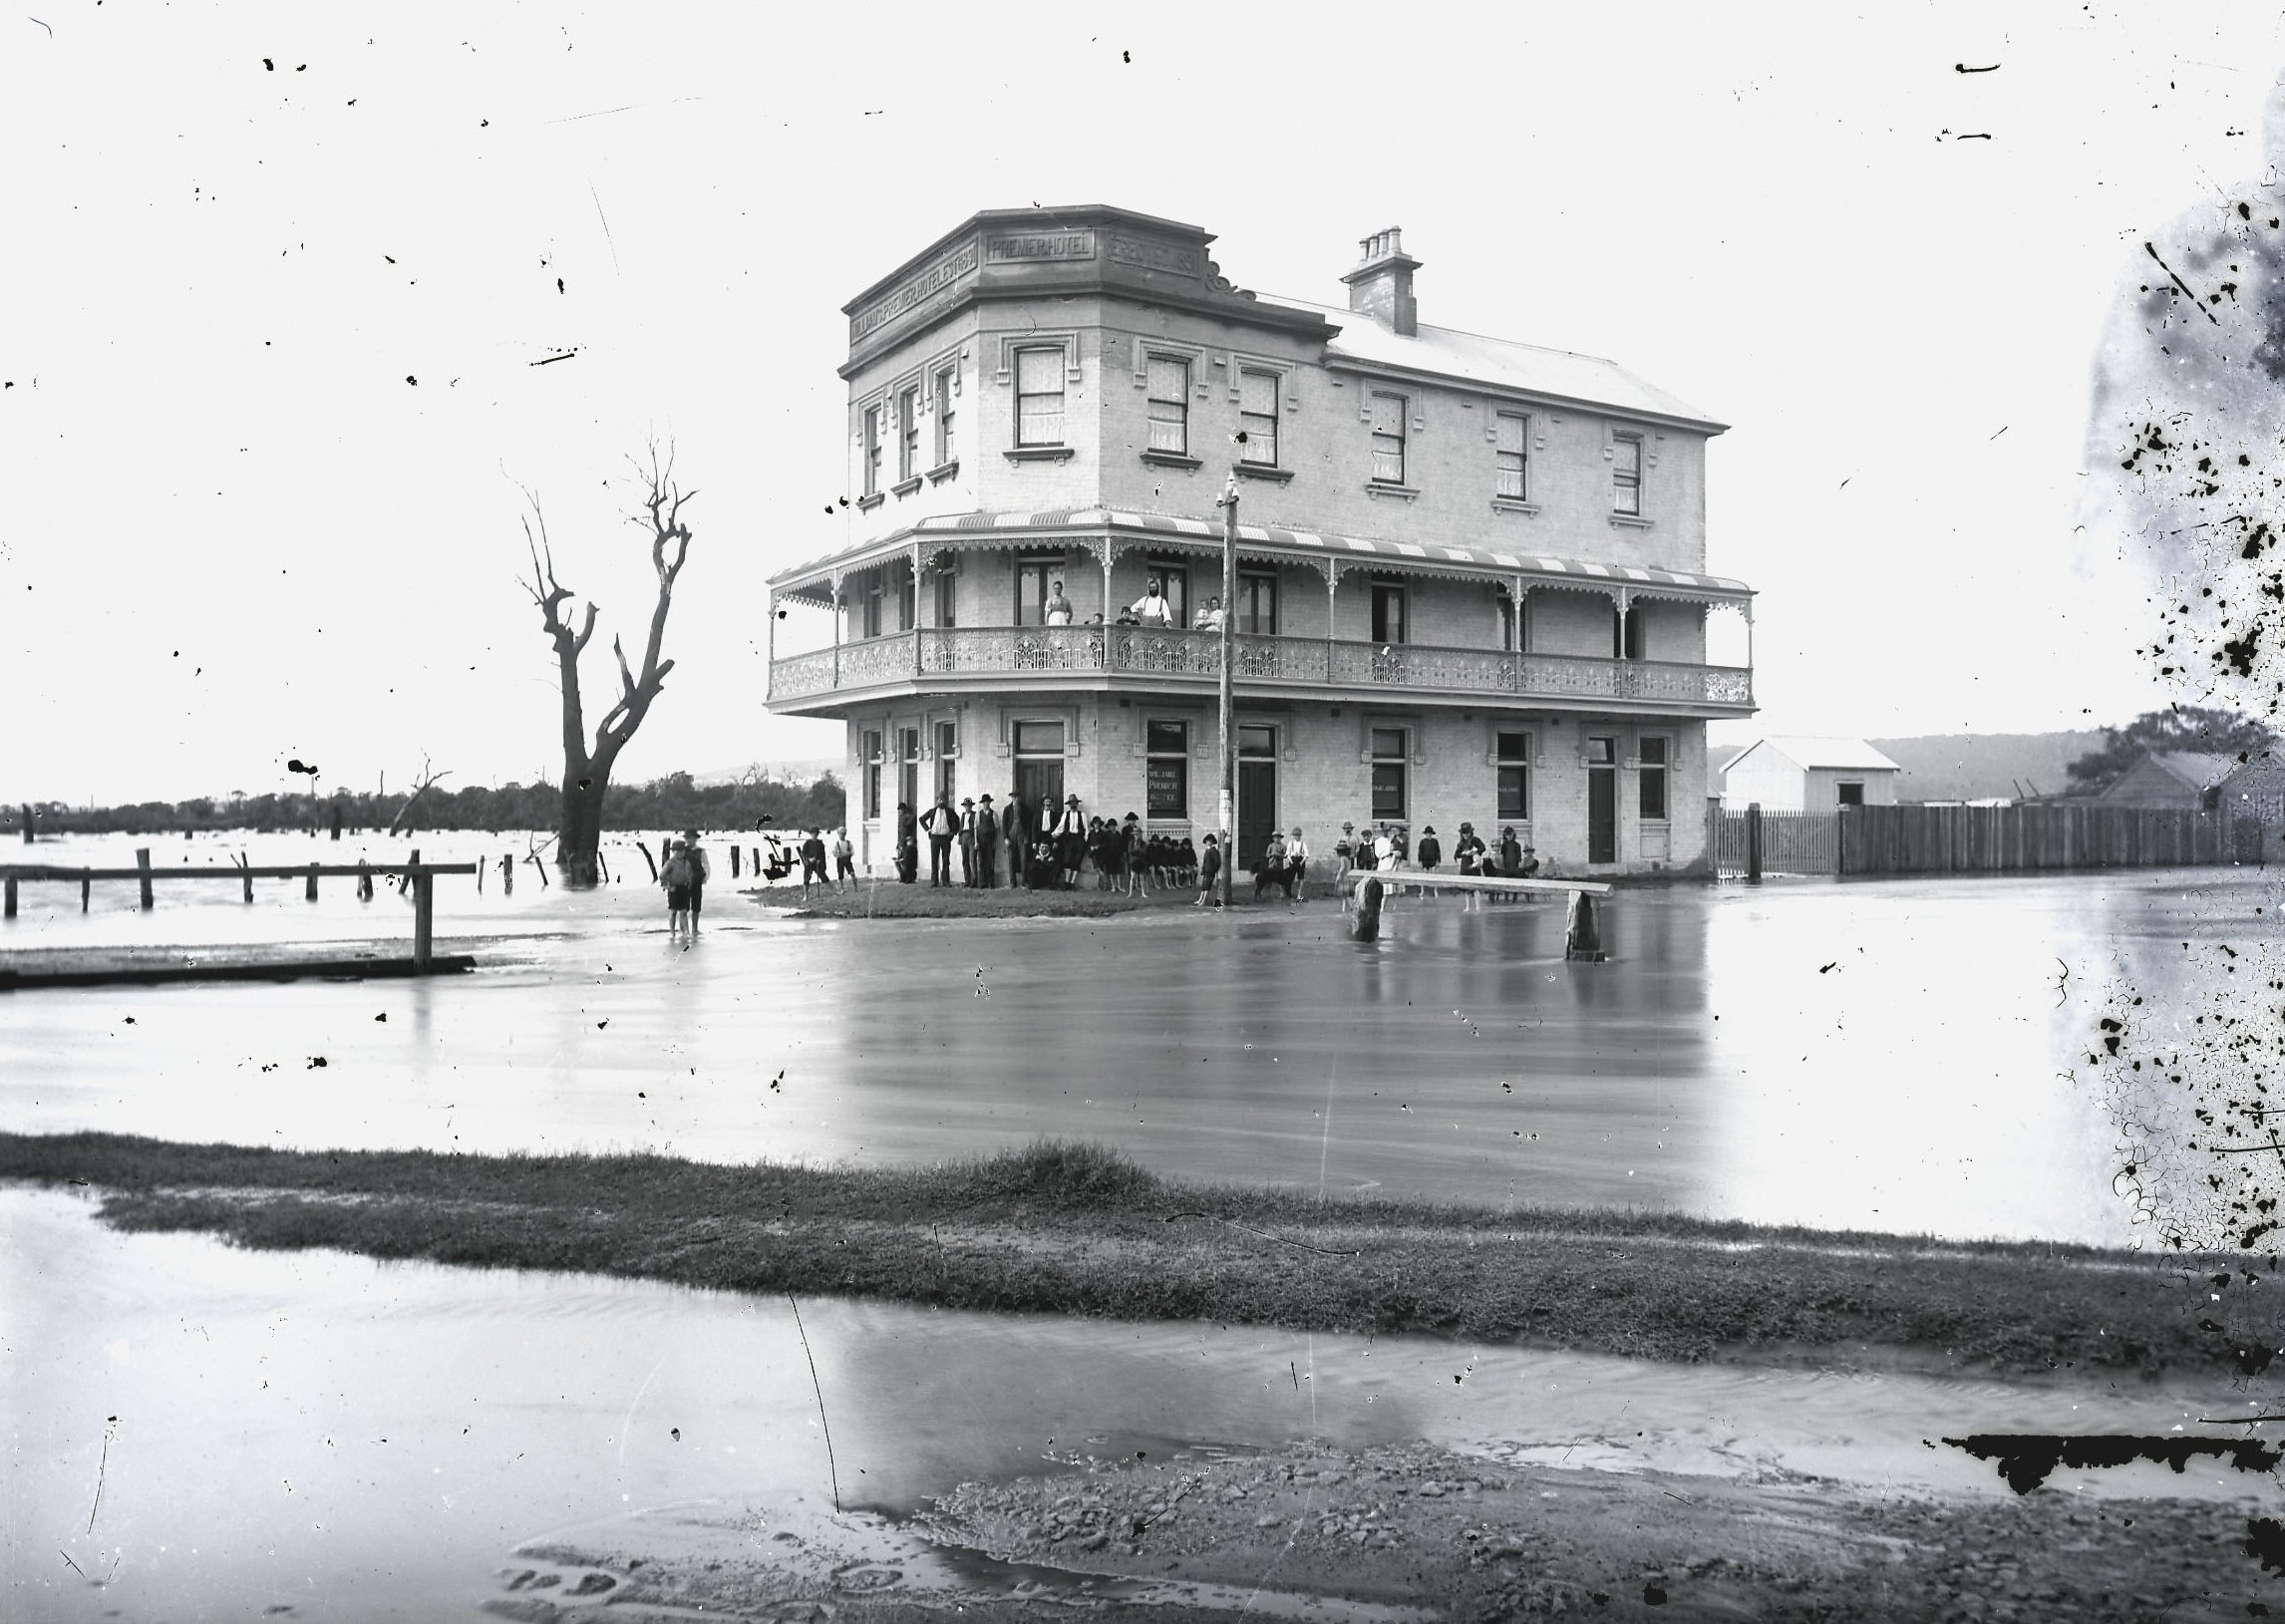
Premier Hotel in Broadmeadow surrounded by flood waters in 1892. Photo by Ralph Snowball. University of Newcastle Cultural Collections.
The 1897 Ralph Snowball photograph below looking from Glebe Rd Merewether across to Hamilton graphically illustrates the large plain of unused and unusable land, and with the roads suffering significant water erosion.
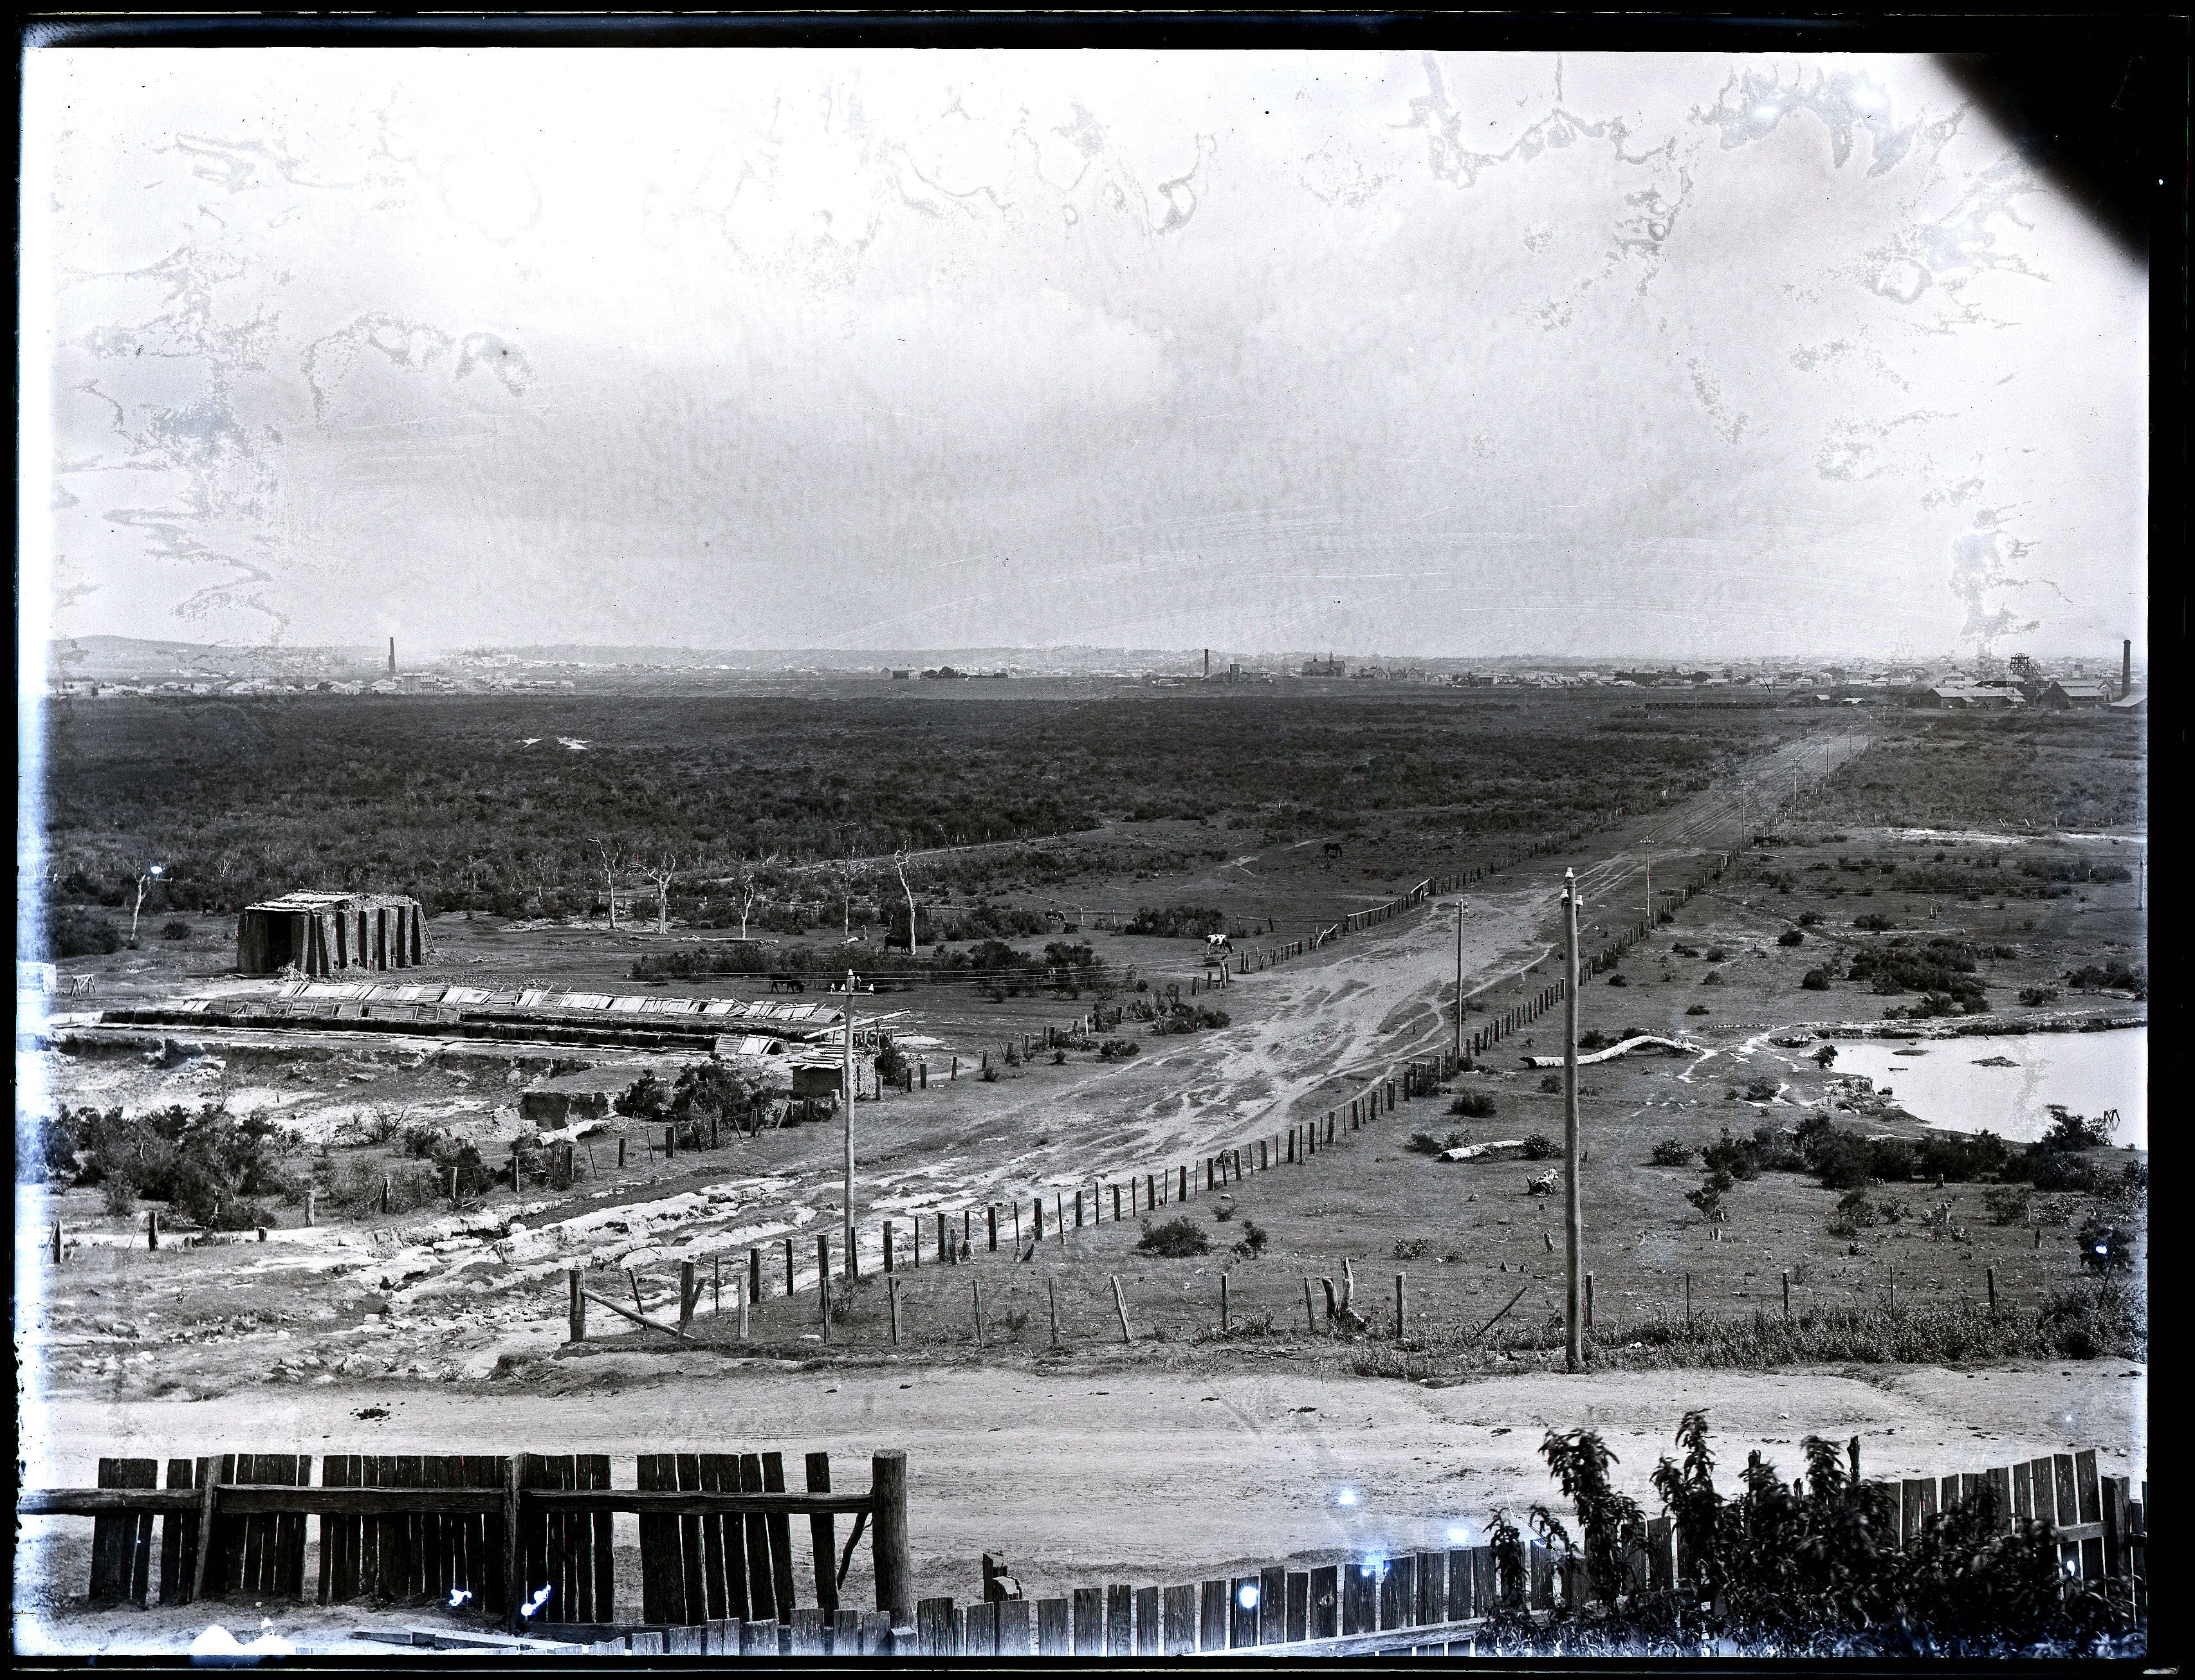
The Newcastle lowlands, 1897. Photo taken from intersection of Beaumont St and Glebe Rd looking north towards Hamilton. University of Newcastle Cultural Collections.
Even as construction was progressing the economic benefit of drainage was clear to see, with an 1897 newspaper report on the extension of the system into Adamstown noting that:
“Its construction will prove a great boon to those residing on the lowlands, and should increase the value of property materially.”
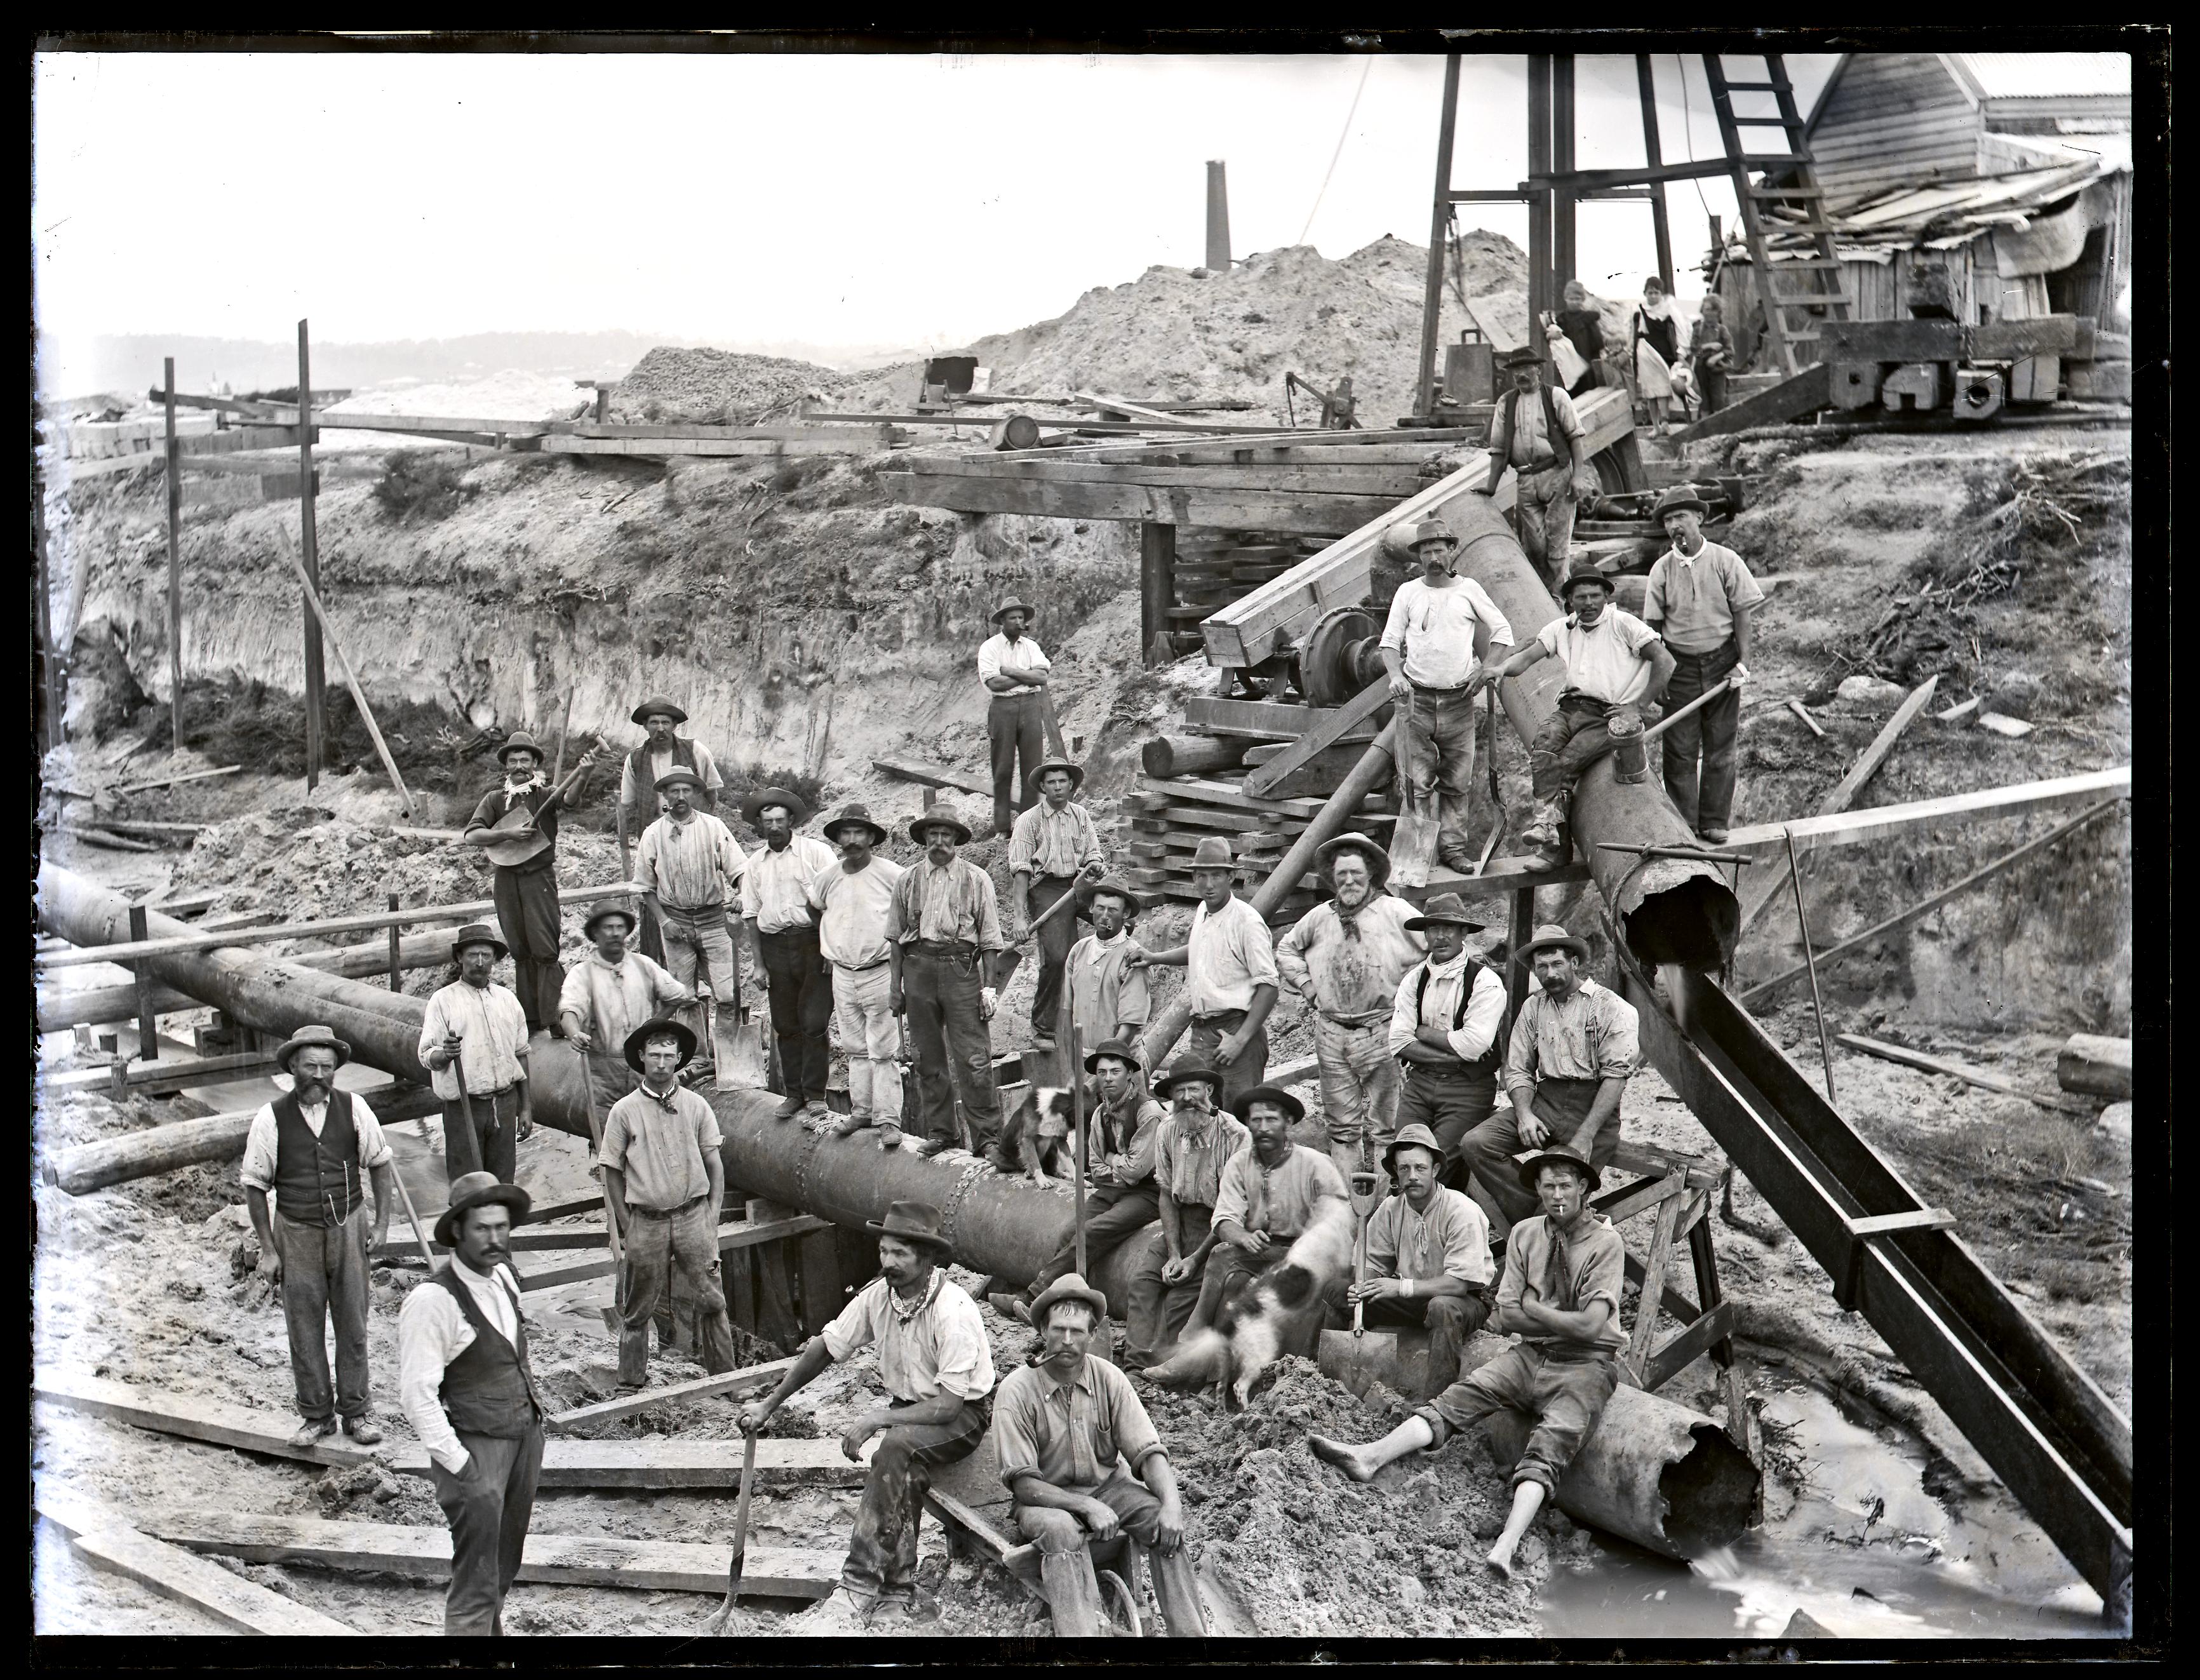
Drain construction workers at Broadmeadow, NSW, 6 April 1900. University of Newcastle Cultural Collections.
The question then is what is the area of the “lowlands” that are emptied by the drainage system? Browsing the altitude data in Google Earth, and observing the landscape around town, 15 metres above sea level seems to be the inflection point where a gradual rise in elevation across the plains changes to a steeper inclinaton of the surrounding hills and ridges. Using Google Earth I marked with yellow lines the concrete drains, and mapped out in blue the area of the drainage basin that is 15m or less above sea level. This area totalled approximately 1850 hectares. [ KML file viewable in Google Earth ]
[ Note, as before, this mapping is a rough approximation for the purpose of gaining a broad sense of the capabilities of the drainage system, and not a precise hydrological survey. ]
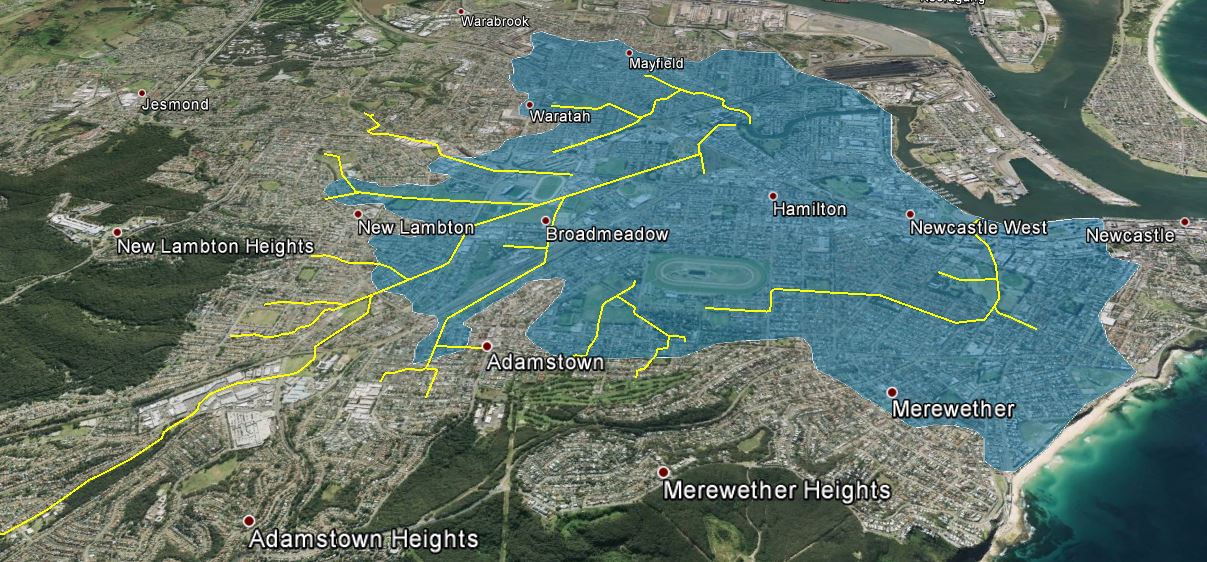
Newcastle concrete drain system. Area shaded blue is 15m or less above sea level.
As an aside, when I first viewed the map of the drains against the shaded lowlands, it immediately struck me that there is a large area centred on Hamilton that has no open concrete drains, and my recollection is that in the June 2007 Pasha Bulker storm, Hamilton was one of the main areas of flooding. Coincidence or not? I don’t know, as I keep reminding you, I’m not a hydrologist.
Nor am I an economist. With that final disclaimer out of the way I can now ask, how much is all that land worth? What is the monetary value of the land made productive by the open concrete drain system? As an example of land values, the NSW Valuer General shows that in 2015 a 424 m2 area of land in Hamilton North had a value of $327,000. This equates to $771 per square meter, or $7.7 million per hectare. If we assume that only 75% of the 1850 hectares is usable (allowing for roads, creeks, etc) then the total land value of the lowlands shaded in the map above is … 10.7 billion dollars!
So the next time you pass one of those ‘ugly’ concrete drains … give a bit of respect.
For more drain related musings, check out Mark Maclean’s Hamilton North blog.
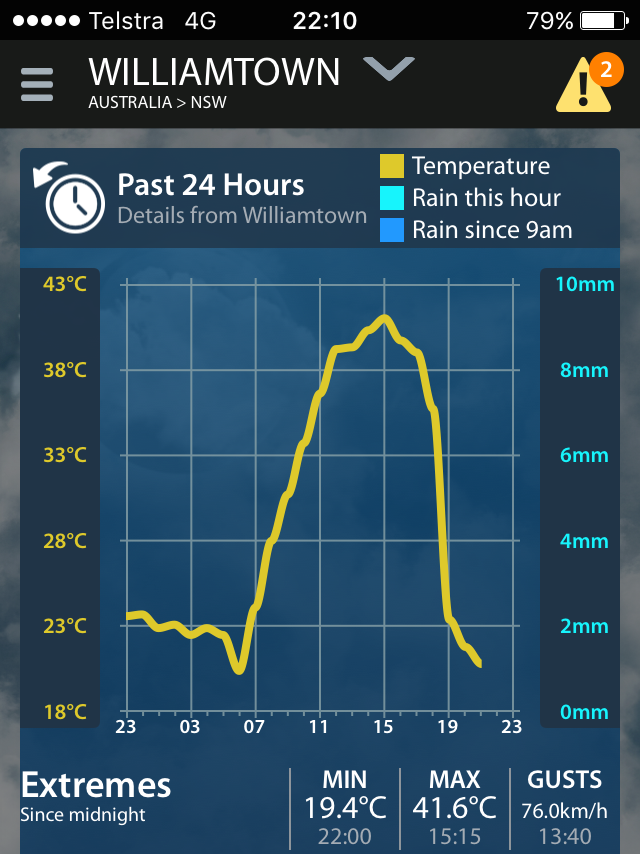 What a strange day yesterday weatherwise, as this graph of temperature at Williamtown shows. From 19° at 6am up to 41° at 3pm and back down to 19° at 10pm. A total temperature transition of 44° in just 15 hours!
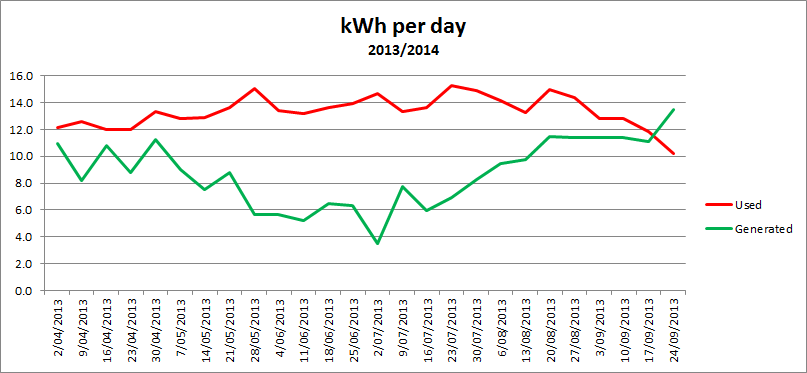
Geek that I am, I truly know that spring has sprung not because of the budding blossoms or swooping magpies, but because my solar electricity generation has begun to exceed our electricity usage.
When you’re Virgin Australia airlines. I just spent a frustrating hour trying to do a web check in on the Virgin Australia website, trying to work out what my Reservation Number was, having booked through another travel website. It turns out that the reservation ‘number’ I had to enter was actually a 6 character alphabetic code (like “MFDJDX”) and not a number at all! Completely dopey.
Following on from my recent post on my ‘mid year report‘ on my bike riding to work, I now calculate a number, that perhaps ought not to be calculated, but I’m going to since I have the following information:
Which gives me enough information to calculate …
Average amount of soap used per shower = 0.33 grams.
Hmmm… perhaps too much information?
Now 0.33g sounds like a ridiculously small number, but bear in mind that I’m washing off the sweat from a 20 minute bike ride, not the grime from an 8 hour shift down a coal mine, and the soap I’m using isn’t some dainty melt in your hand luxury product, but more of an el-cheapo industrial grade soap mixing it with the high flyers on Mohs scale of hardness.
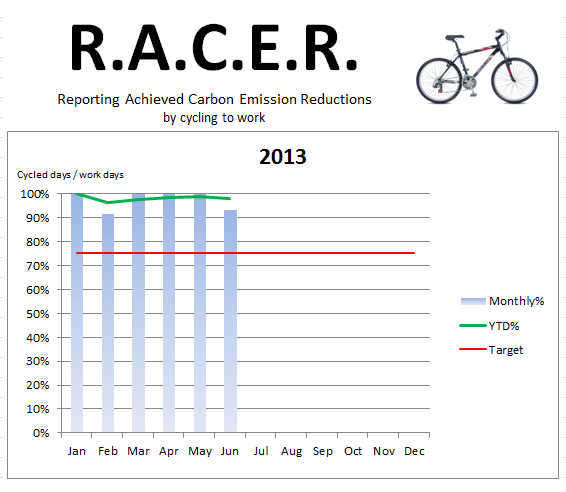
Its mid year, and the kids half year reports have come home. I thought I’d share my own half year report on how I’m doing riding to work. I’ve been riding to work for 4 and half years now, and each year I set myself a target of a percentage of work days that I aim to ride to work, and each year I’ve increased the target. This year my target is 75% and, it looks like I’ve set the bar way too low.